


Network Capturing with Wireshark
Tools needed:
Ability to turn off firewall
Woodward AppManager
Latest version of Wireshark (WinPcap included in download)
Managed switch or router with a Mirror port. (A mirror port is the ability to look at all the traffic on a specific port to watch on the switch.)
Optional: network tap if the switch is unmanaged
Optional: Latest version of Windump, the Windows port of TCPDump
Optional: VS Code for easy viewing of system log files
Optional: GRASSMARLIN an additional network monitoring tool, very visual
Optional: USB network adapter (IT Request) for additional Ethernet port if needed
NOTE: If you are for some reason unable to use these methods, refer to this guide on netsh trace for Windows 7 or newer.
Mirror Port:
If there is no on-site IT that can set up a mirror port (or ‘spam’) look up diagnostics in configurator for the switch you are using. The switch will have embedded programming. You want to view bi-directional traffic.
Data from the control:
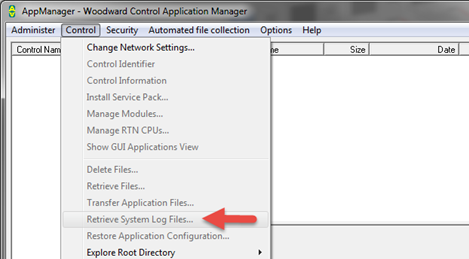
Use AppManager to download the system logs for the control. Open AppManager, select the Control Menu and Retrieve System Log Files (log, logfile, syslog, and possibly pmlog). These will save the files to the local drive. Make a note of the path and zip the files up.
Network setup:
The Mirror port or network tap should be configured to watch all traffic going into the control (Micronet or Atlas). This is done through the switch/router configuration. This will involve designating a port to monitor (the port connected to the control) and a port designated as the mirror port. Connect the workstation with Wireshark and WinPcap to the mirror port.
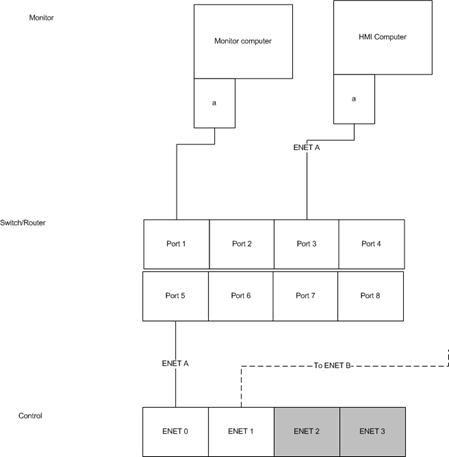
In the above diagram a managed switch/router with a mirror port is used, the Monitored port will be Port 5, the mirror port will be Port 1. Normally the HMI Computer and Control are connected making up ENET A. ENET B is the backup control network.
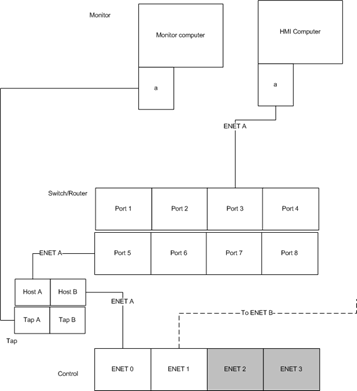
The above diagram reflects using a network tap to monitor traffic.
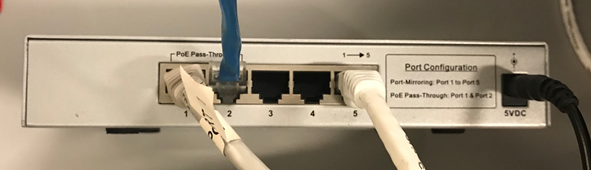
The above is an example of a setup using a tap, where port 1 is wired to an Atlas, port 2 to an unmanaged relay, and port 5 mirrors these to laptop.
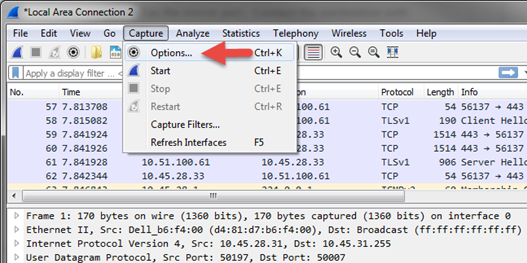
To begin the capture, start Wireshark and open the Capture Options dialog box by clicking the Capture->Options….
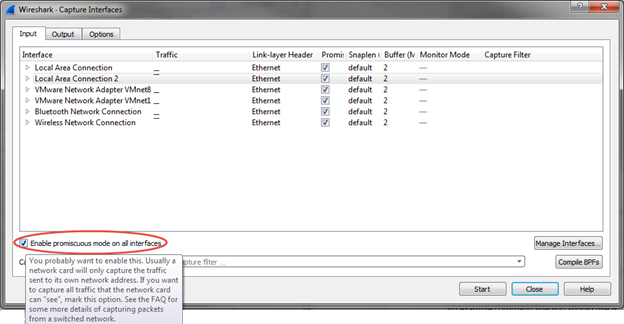
Capture in promiscuous mode by clicking the “Enable Promiscuous Mode on all Interfaces” checkbox.
Capture traffic for 10-15 minutes, or during a network event. Stop the network capture and save the capture file.
Troubleshooting Tips:
- Wireshark (especially display filters) and the log.txt file are your best friends.
- Display filters use logical orders (Ex: !TCP will show all non-TCP)
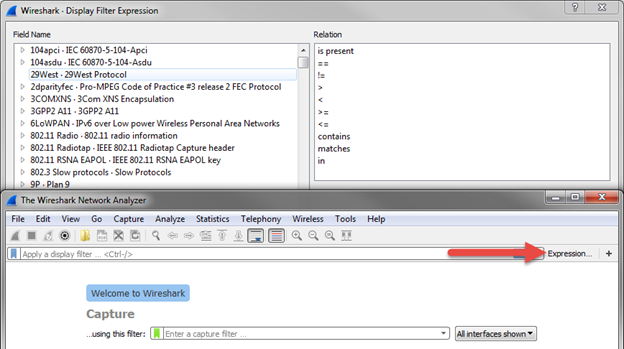
- Click "Expression..." for help creating filters
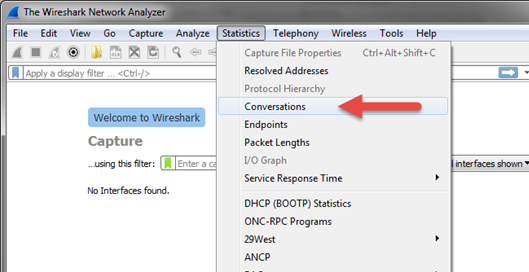
- Filters can also be created in conversations by right clicking
- If there is a large number of TCP (Transmission Control Protocol) conversations with a low number of packets (<11), indicates connection issues.
- UDP (User Datagram Protocol) destination port 5134 is general broadcast from control, sends out every 2 seconds. If this has stopped indicates connection issues.
- ARP (Address Resolution Protocol) shows what is on network, look at MAC (Media Access Control) addresses (will show company, ex: woodward, dell…).
- ARP storm (teamed networking) occurs when 2 adaptors share an IP address.
- In AppManager control information, make sure adaptors have unique subnets.
- ARP storm (teamed networking) occurs when 2 adaptors share an IP address.
- ARP table overwrite can lead to loss of view, find on control logfile.txt: HEX overwritten by MAC. Translate hex into IP address and find on network. Pay attention to timestamps to be sure this is currently relevant.
- Questionable network analysis with ball on lower left corner (expert information).
- Next to that is pencil icon, summary info for packet capture. Capture file comments are useful for site notes (IP addresses, notes…)
- Statistics > IO Graph will show a graphical representation, easier to see where issues are occurring over a capture
Windump:
Alternatively one can capture files using Windump and the command line.
An example command line you should use is:
windump –s65535 –w.\filename.pcap
Alternatively:
Windump –w.\filename.pcap –C 10MB –W 200
20 10MB files captured in a ring format (files will not get excessively large)
The above command line assumes 1 NIC is active.
Add a comment
Please log in or register to submit a comment.